-
Github Interactive Things - Grundlagedaten für Urban Data Challenge von 2013
2013: This repository provides you with public transportation data sets from Zurich, San Francisco and Geneva for the www.urbandatachallenge.org. Throughout the repository...Keine Datensätze Github Interactive Things - Grundlagedaten für Urban Data Challenge von 2013 ansehen -

Dots on the Bus - Urban Data Challenge 2013
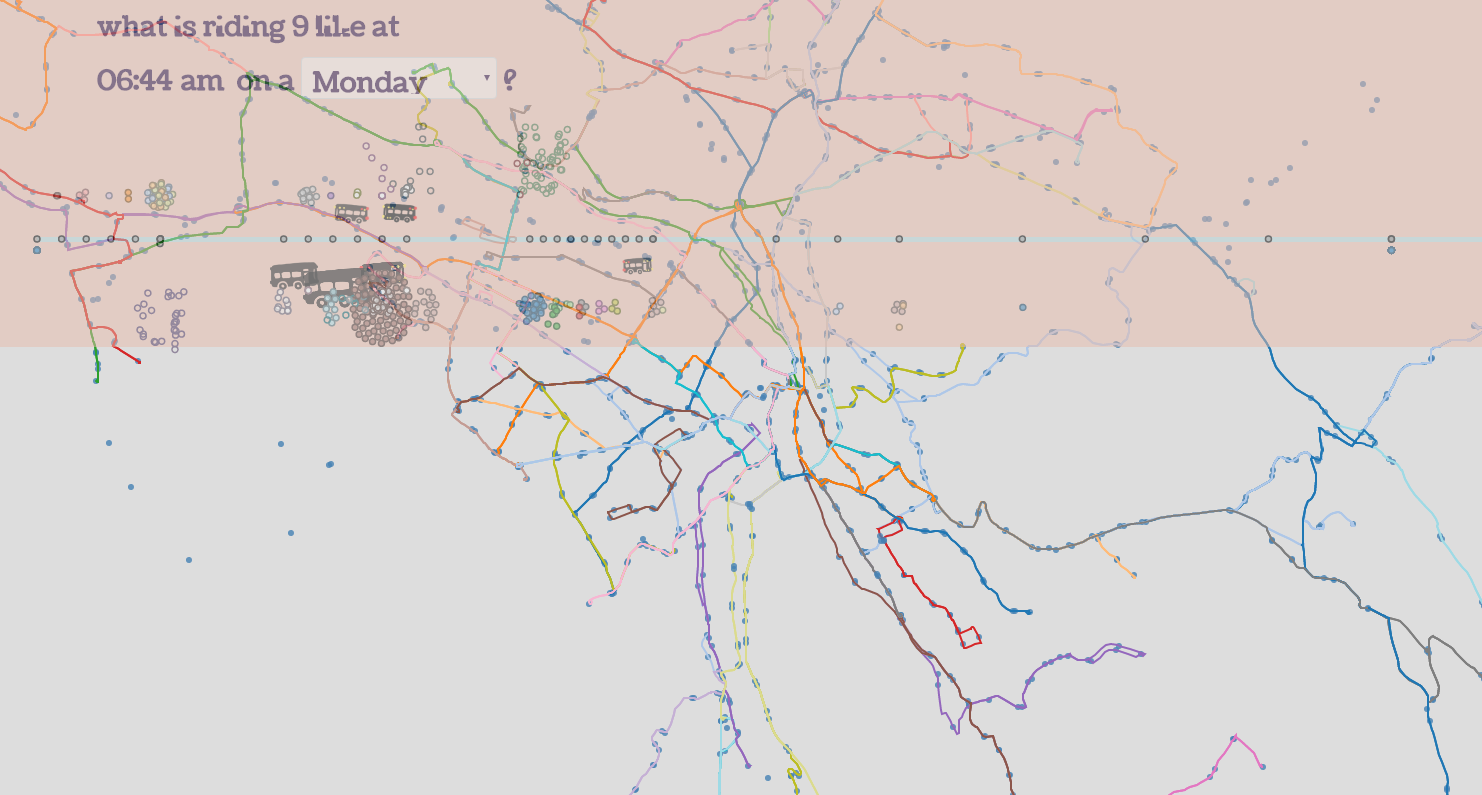
Sometimes riding transit can seem intimidating, but this visualization proves it: everybody’s doing it. Pick a route off the map and watch a day in the life of the line. Buses...Keine Datensätze Dots on the Bus - Urban Data Challenge 2013 ansehen -

Frustration Index - Urban Data Challenge 2013
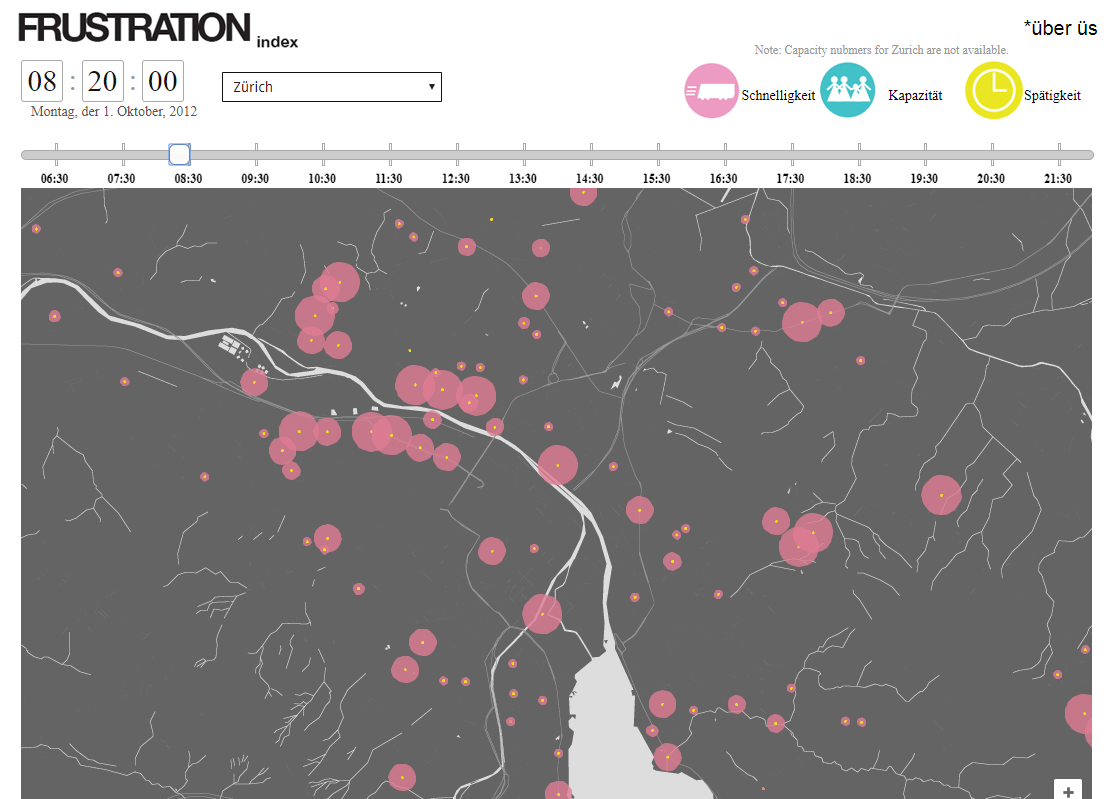
Frustration Index shows the Level of Service (or Frustration) for transit services in San Francisco, Geneva, and Zurich. Our web application visualizes...Keine Datensätze Frustration Index - Urban Data Challenge 2013 ansehen -

Transit Quality + Equity - Urban Data Challenge 2013
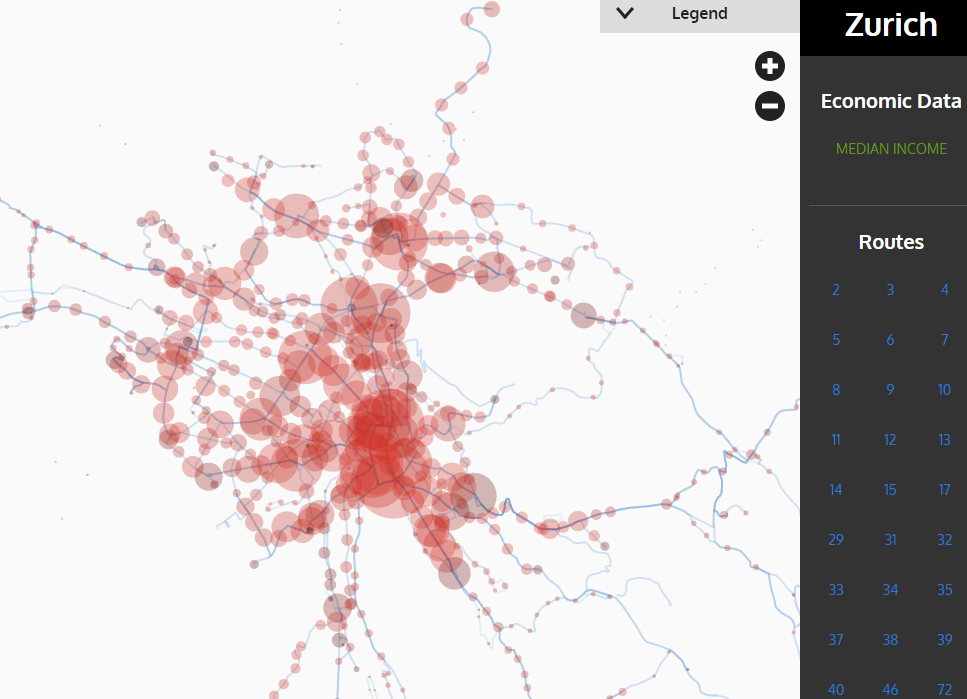
Transit performance is often solely measured by speed and efficiency. But how well do transit systems actually serve the diverse populations in a city? Do people of different...Keine Datensätze Transit Quality + Equity - Urban Data Challenge 2013 ansehen